In project management, the most dangerous question you can be asked is: “Are we on track?” Without the right data, you’re just guessing. To answer with confidence, professional project managers use Earned Value Management (EVM).
We have built a EVM Calculator to help you stop guessing and start forecasting. This article explains the “language” of project finance and how to use our tool to save your project from budget overruns.
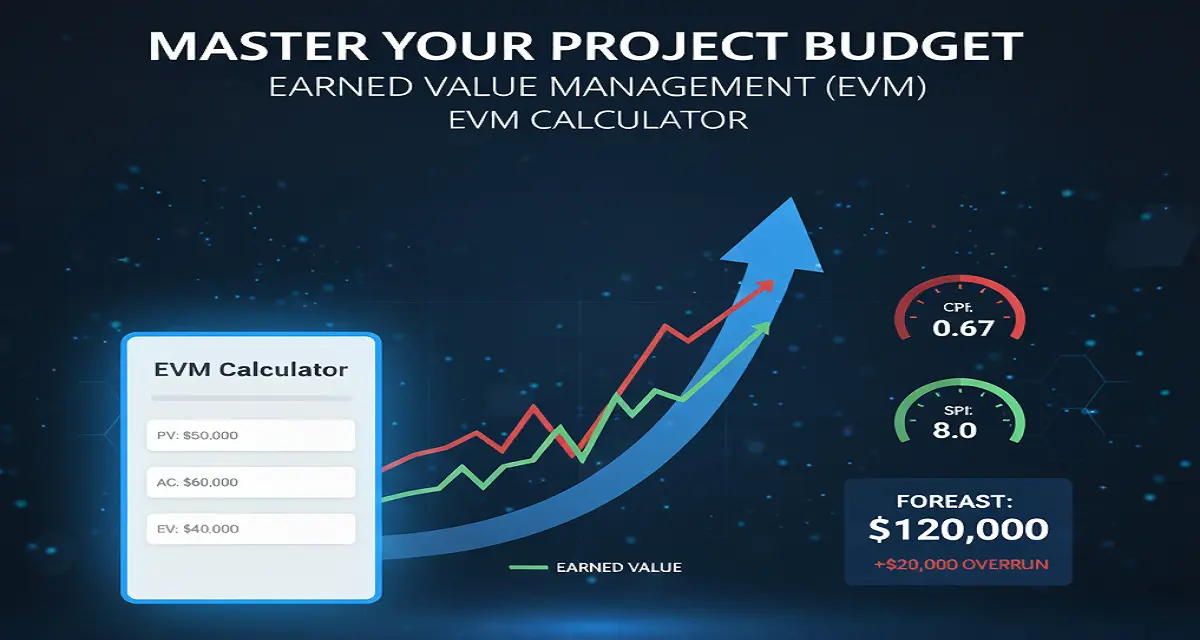
Master Your Project Budget with Earned Value Management (EVM)
Use this professional EVM calculator to measure your actual progress against your spend.
Project Data Entry
Live Health Indices
Visual Variance Analysis
How to read this calculator
CPI (Cost Performance Index): Measures your financial efficiency. A value of 1.0 or higher means you are on or under budget. Anything lower indicates you are overspending for the work produced.
SPI (Schedule Performance Index): Measures time efficiency. A value of 1.0 or higher means you are ahead of schedule. If your SPI is 0.8, you are only progressing at 80% of your planned speed.
Earned Value Management (EVM) Calculator
Understanding the Terms: The “Big Four” Metrics
To use the calculator effectively, you need to understand the four primary inputs. These are the building blocks of every project health report.
1. Planned Value (PV)
The “What we should have done” metric.
PV is the authorized budget assigned to the work scheduled to be completed by a specific date.
- Example: If your 10-month project has a total budget of $100,000, at month 5, your PV should ideally be $50,000.
2. Actual Cost (AC)
The “What we actually spent” metric.
This is the total cost incurred for the work performed so far. It includes labor, materials, and overhead.
- Example: You might be at month 5, but you’ve already spent $60,000. This is your AC.
3. Earned Value (EV)
The “What we actually accomplished” metric.
This is the most critical number. It measures the value of the work actually completed, regardless of what you spent or what you planned.
- Example: Even though you spent $60,000 (AC), you might only have finished 40% of the project. Your EV is 40% of the total budget ($40,000).
4. Budget at Completion (BAC)
The “Total Pot” metric.
This is the total budget you were originally given for the entire project.
How to Interpret the Results
Once you enter your numbers into the calculator, it generates two “Efficiency Indices.” These are the pulse of your project.
| Metric | What it Tells You | The “Health” Rule |
| CPI (Cost Performance Index) | Are you over or under budget? | > 1.0: Good (Under Budget) < 1.0: Bad (Over Budget) |
| SPI (Schedule Performance Index) | Are you ahead or behind schedule? | > 1.0: Good (Ahead) < 1.0: Bad (Behind) |
The Crystal Ball: Forecasting with EAC
The most powerful feature of this calculator is the Estimate at Completion (EAC). By taking your current spending efficiency (CPI) and applying it to your remaining budget, the tool predicts the final bill of the project.
If your CPI is 0.8, the calculator assumes you will continue to be 20% inefficient and will alert you that your final cost will be significantly higher than your original budget.
Step-by-Step: How to Use the Calculator
- Gather your data: Check your invoices (for AC) and your project schedule (for PV and EV).
- Input your variables: Enter the values into the designated fields.
- Check the Colors: * Green Metrics: You are performing efficiently. Keep doing what you’re doing!
- Red Metrics: You are burning through cash or time too fast. You need to adjust your resources or scope immediately.
- Analyze the Chart: Look at the Variance Analysis bars. A large gap between the “Earned Value” and “Actual Cost” bars is a visual warning of a struggling project.
- Export and Share: Click the “Export Report” button to generate a PDF. This is perfect for status meetings, as it provides a professional, data-backed summary of the project’s health.
Summary
EVM isn’t just for math enthusiasts; it’s for any project manager who wants to be proactive rather than reactive. By using this calculator regularly, you can spot trends early enough to fix them before the budget runs dry.